
Profiles & Cross-Sections | QGIS DTM Plugin | SinoCloud
Profiles, Cross-Sections and Municipalities — Elevation Profiles and Cross-Sections for QGIS
Elevation profiles, cross-sections with cut/fill volumes, TINITALY/HR-DTM-5m DTM download, ISTAT municipality search and before/after comparison: all in a single free, open source QGIS plugin.
Profiles, Cross-Sections and Municipalities is the QGIS plugin designed for anyone working daily with surveying, earthworks and technical cartography: draw an axis on the map and instantly get the elevation profile (with a live "ProfiloExpress" preview while drawing) and the real cross-sections with automatic calculation of areas and cut/fill volumes.
There's no need to look for a DTM elsewhere: the plugin automatically downloads and clips the official TINITALY 1.1 (INGV, 10 m) or HR-DTM-5m (Zenodo/CNR, 5 m) tiles on the drawn area — even set automatically by searching an Italian municipality in the official ISTAT archive, with no dependency on OpenStreetMap or Nominatim. It also includes a before/after works comparison between GeoPackages or between DTMs, with a difference raster and excavation/fill volumes.
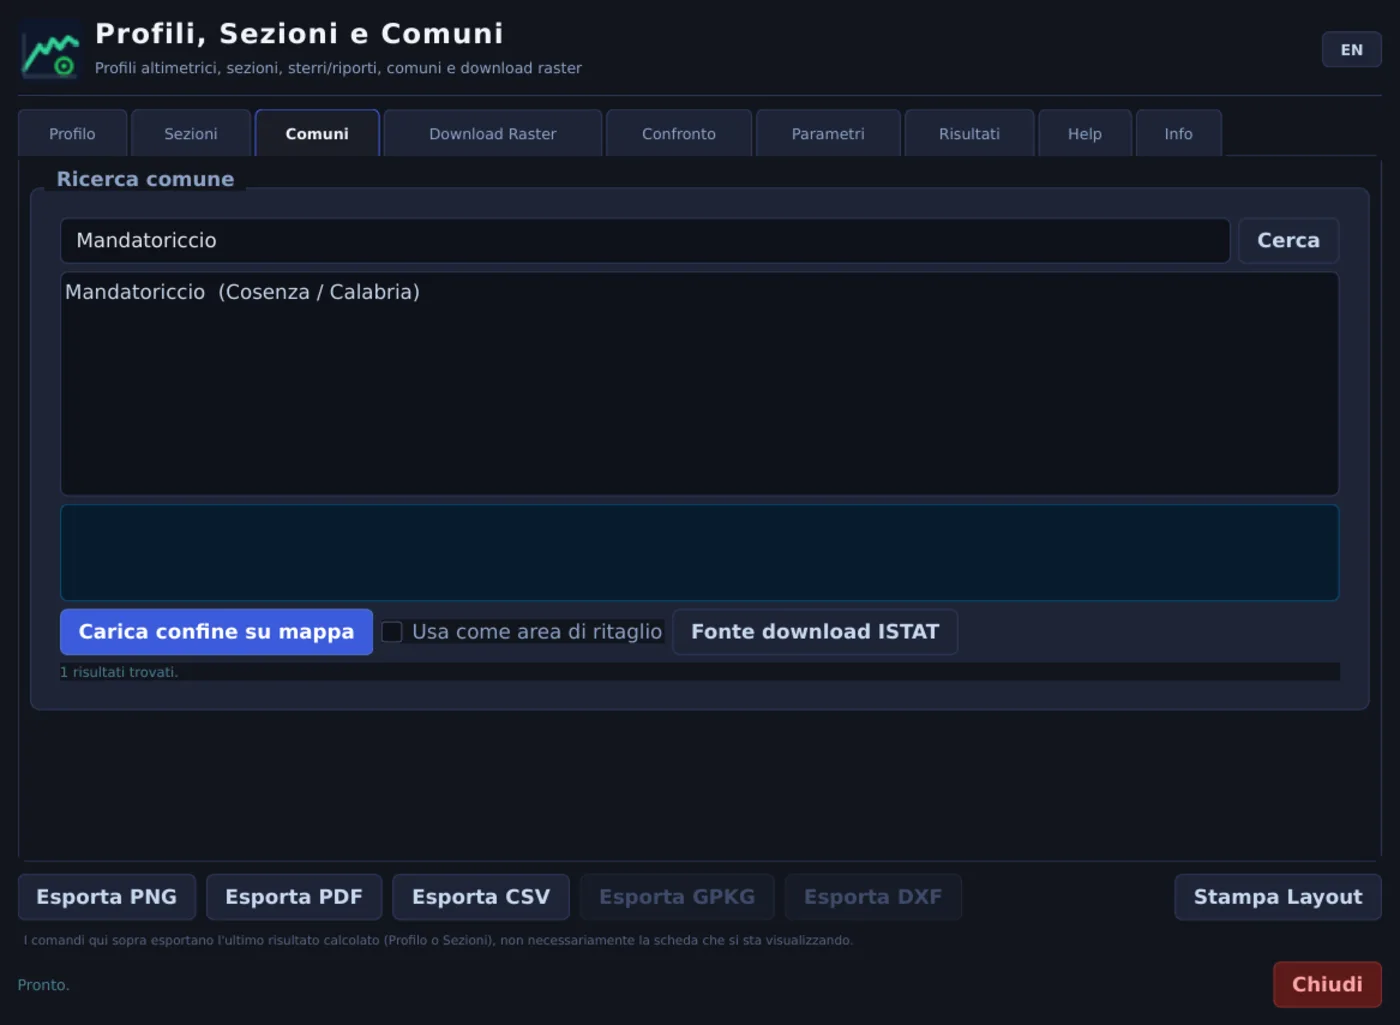
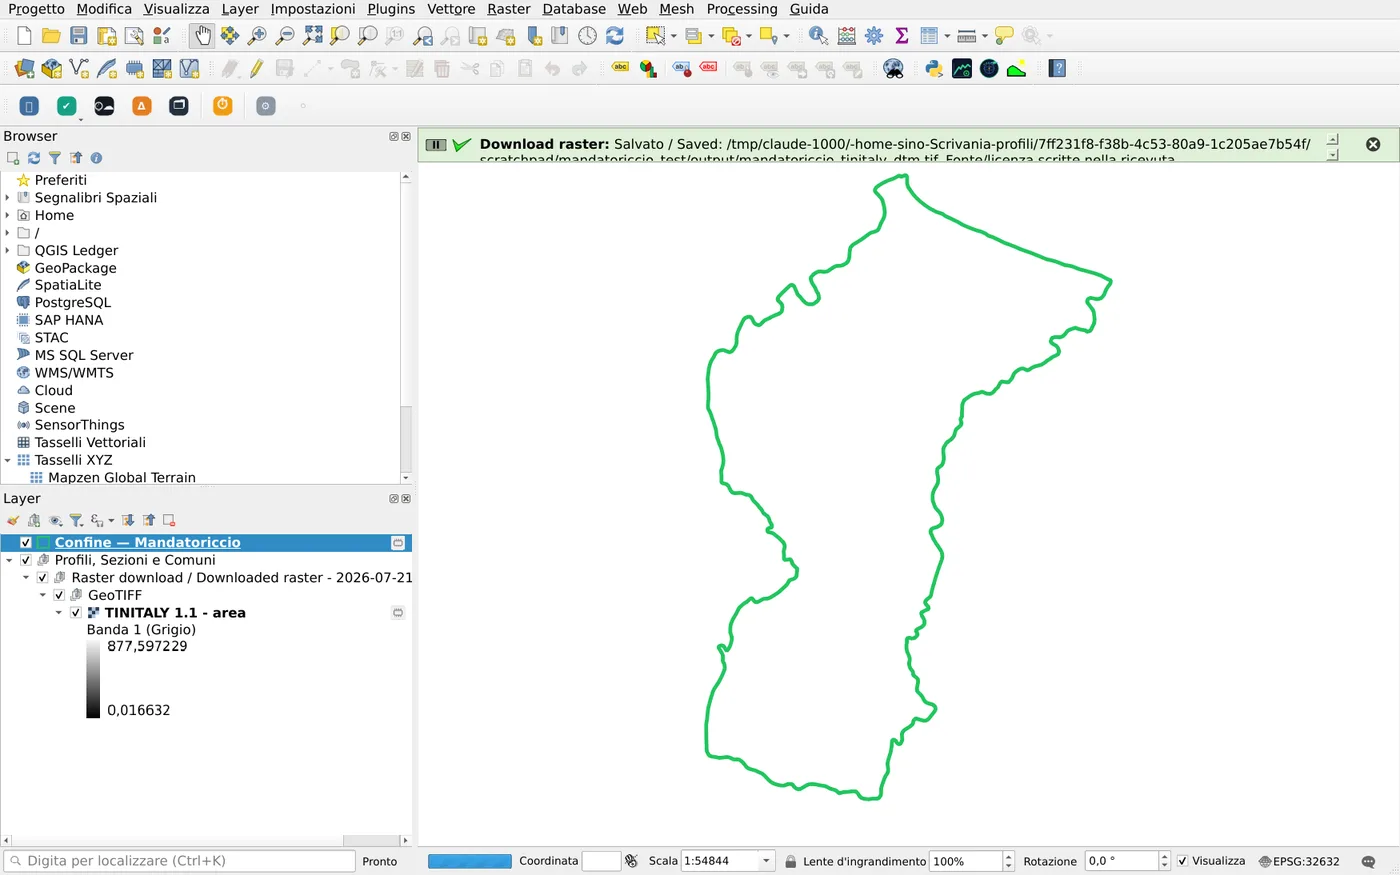
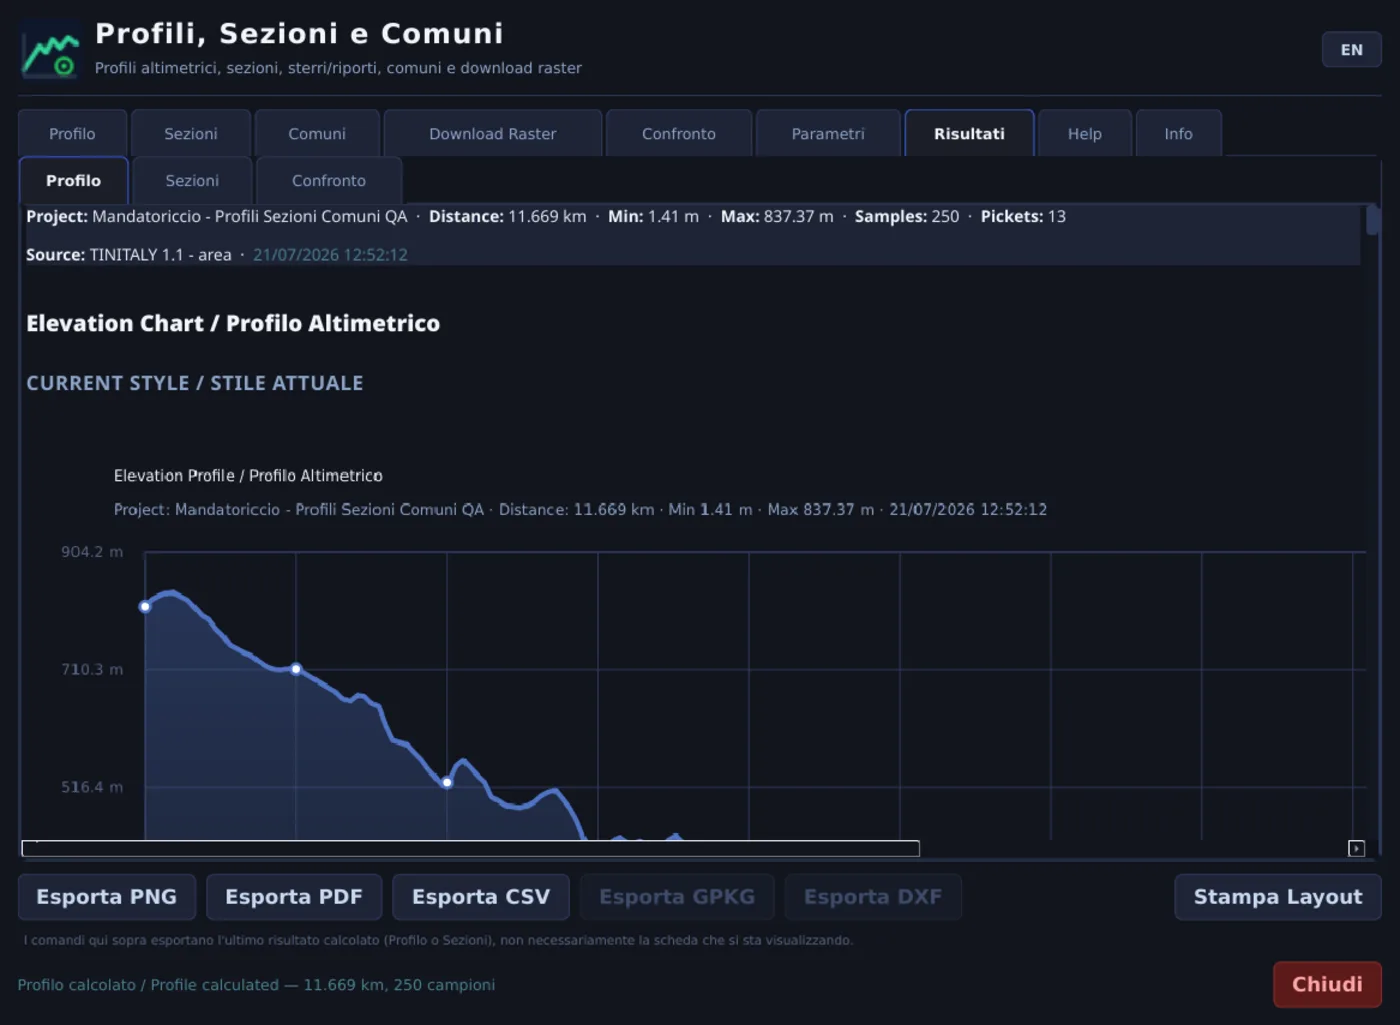
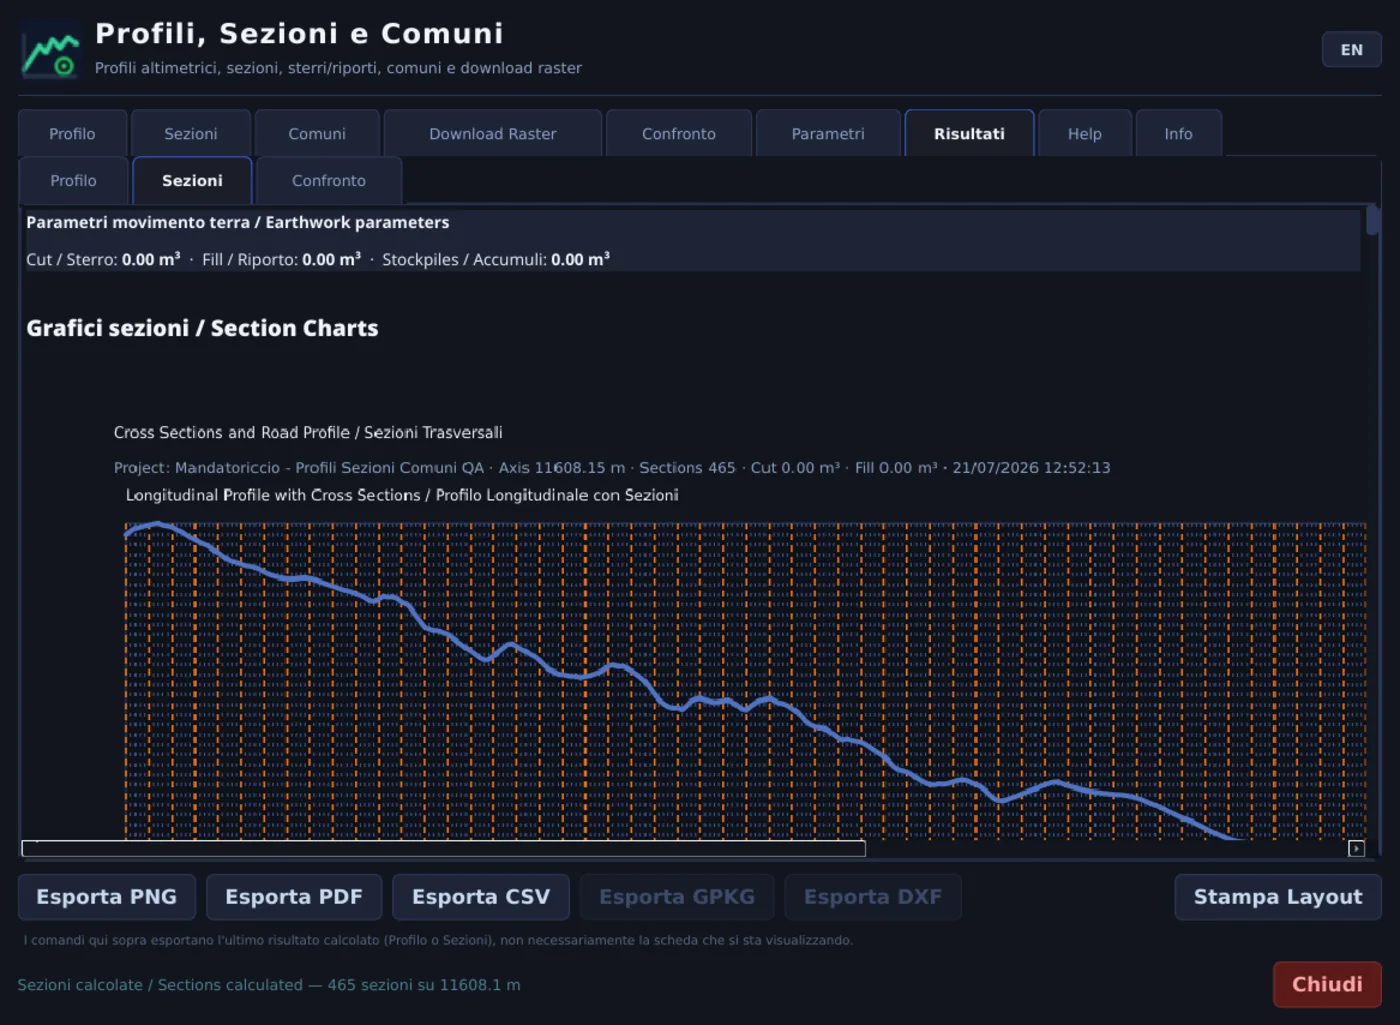
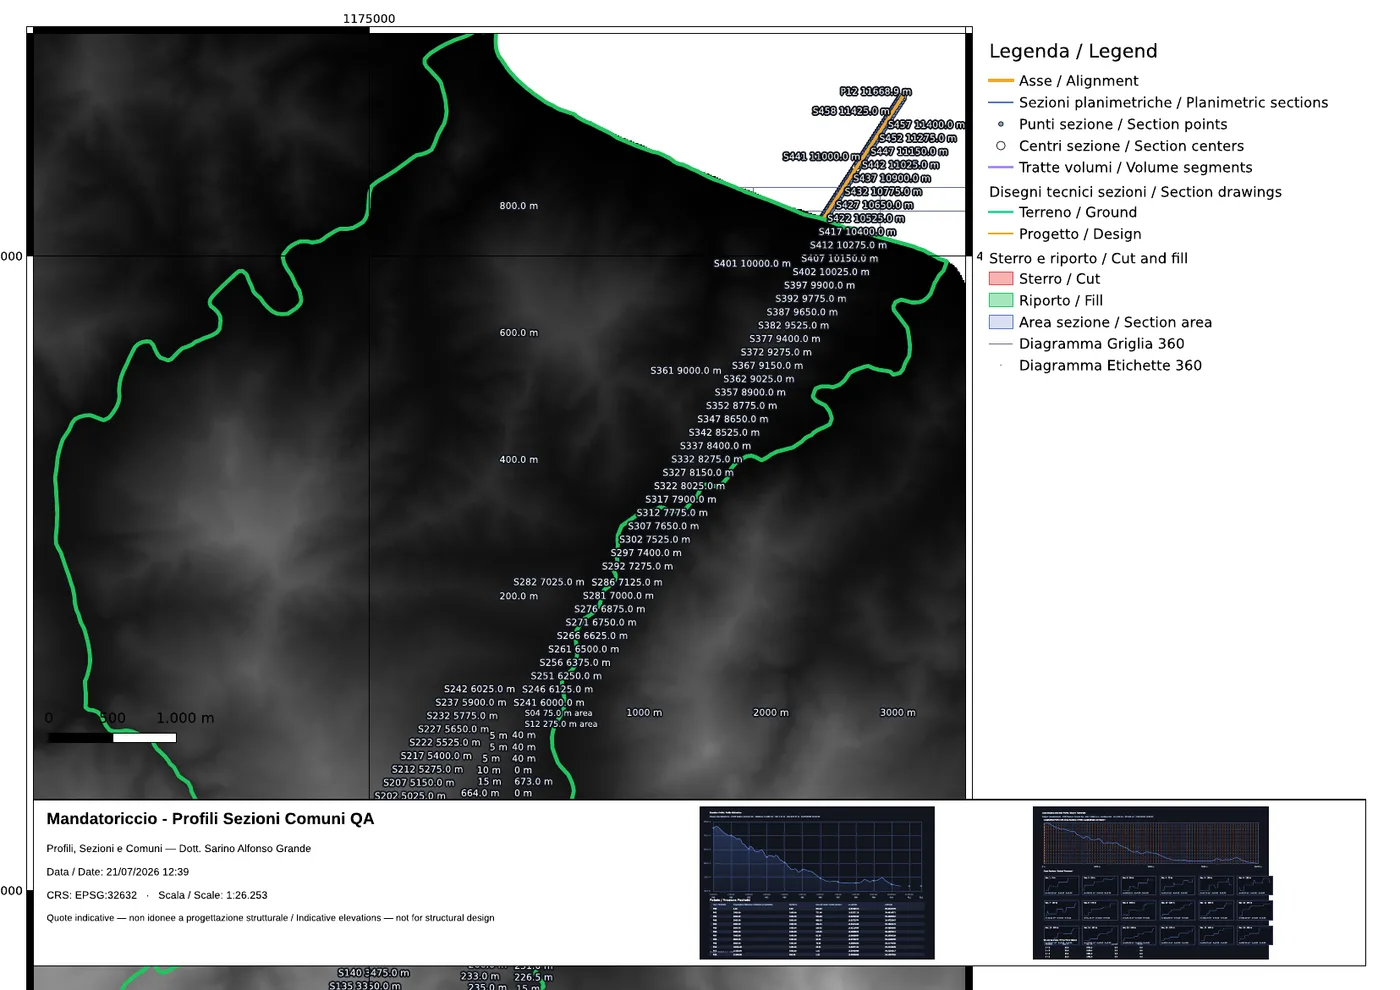
The Plugin in a Real Project in Mandatoriccio (CS)
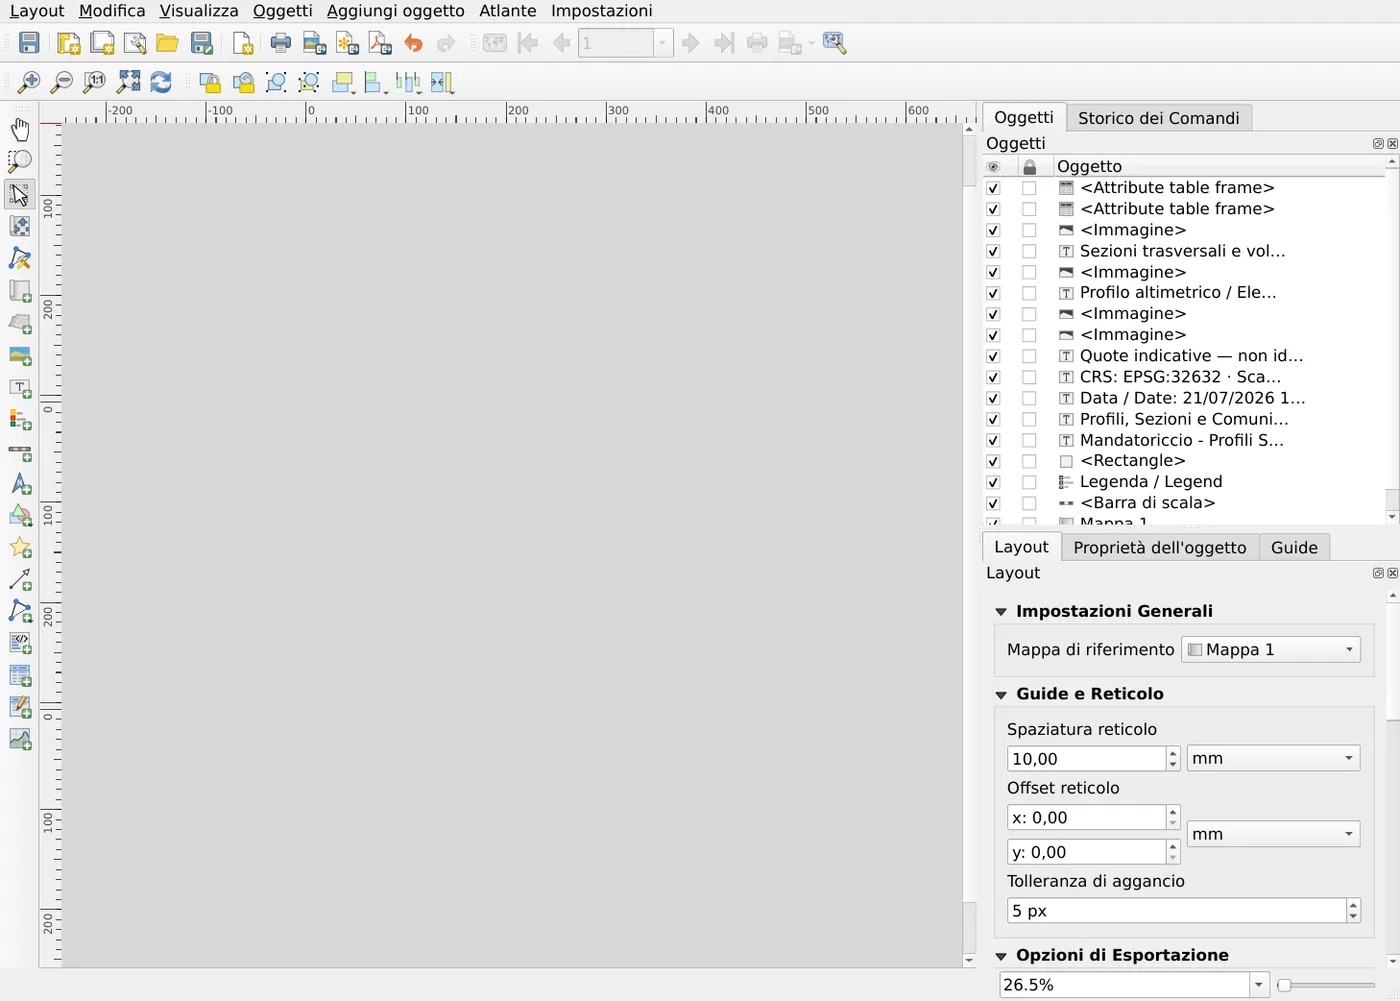
A real end-to-end case: municipality search, TINITALY DTM download, profile and cross-section calculation, print layout and PDF export.
Main Features
Elevation profile + ProfiloExpress
Draw the axis on the map and get the complete elevation profile, with a live preview that updates in real time while you draw.
Cross-sections and cut/fill volumes
Real cross-sections at regular intervals, with calculation of cut/fill areas and volumes relative to a design elevation or slope.
TINITALY / HR-DTM-5m DTM download
Download and clip the official TINITALY 1.1 (INGV, 10 m) or HR-DTM-5m (Zenodo/CNR, 5 m) tiles onto the drawn area, with progress/ETA and license citation.
Municipality search via ISTAT
Search for an Italian municipality and load its official administrative boundary directly from the ISTAT archive, cached locally after the first download.
Before/after works comparison
Compare GeoPackages generated by the plugin or two DTMs (difference raster) to calculate excavation/fill volumes between two surveys.
Complete exports
PNG, cartographic PDF with print layout, CSV with data tables, vector GeoPackage and DXF for technical drawings.
How It Works
Search the municipality
Search for an Italian municipality in the Municipalities tab (official ISTAT archive) and load its administrative boundary.
Download the DTM
Use the boundary as the clipping area and download the TINITALY 1.1 or HR-DTM-5m DTM directly in QGIS.
Draw the profile and cross-sections
Draw the axis on the map: the elevation profile and cross-sections with volumes are calculated automatically.
Export the results
Generate the print layout and export PDF, CSV, GeoPackage and DXF ready for the technical report.
Frequently Asked Questions about Profiles, Cross-Sections and Municipalities
What is the "Profiles, Cross-Sections and Municipalities" plugin for QGIS?
How do I download the TINITALY DTM with the plugin?
How are cross-sections and cut/fill volumes calculated?
Is the plugin compatible with QGIS 4 and Qt6?
How do I export profiles, cross-sections and tables?
Where can I download the plugin and find the source code?
Is the plugin really free and open source?
Try Profiles, Cross-Sections and Municipalities
Open source plugin (GPL-2.0), installable directly from the official QGIS plugin repository.